South Dakota maintains its position as a top-ranked state for tax competitiveness in 2027
South Dakota has held its ground as one of the most tax-friendly environments in the United States, securing the number two spot in national rankings for 2027. According to data released by the Tax Foundation, the state has maintained this high ranking consistently since 2020, showing no net change in its overall position over the seven-year period. This stability suggests a predictable fiscal environment for both residents and businesses, even as the underlying mechanics of the state's revenue model present a complex picture of winners and losers.
The state’s economic identity is defined by what it does not tax. South Dakota remains one of only two states in the country that avoids imposing individual income, corporate income, and gross receipts taxes. This absence of direct taxation on earnings creates a uniquely streamlined environment for personal financial planning and corporate operations. As reported by taxformcalculator.com, this structure means that residents, part-year residents, and nonresidents do not file state income tax returns related to wages or investment income, a factor that simplifies payroll and reduces the administrative burden on employers.
While the lack of income tax is a significant draw, the state’s reliance on other revenue streams creates specific economic pressures. Because South Dakota does not tax wages or retirement income, it relies heavily on sales taxes, tourism levies, and business taxes to fund essential statewide services. This shift from taxing what people earn to taxing what people spend fundamentally alters the financial experience of different demographic groups.
The trade-off between income exemptions and sales tax burdens
The Tax Foundation’s breakdown of South Dakota’s tax components reveals a stark contrast between the state’s highest-performing categories and its primary fiscal challenges. The state earns perfect scores of 10.00 for both corporate and individual income tax rankings, reflecting its total exemption in these areas. However, the sales tax component tells a much different story, with the state ranking 31st nationally and receiving a score of 4.47 out of 10.
This disparity is rooted in the breadth of the sales tax base. While the rate itself remains competitive, the tax is applied to a wide range of items, including many business inputs. The Tax Foundation notes that this can lead to “harmful tax pyramiding,” where taxes are applied at multiple stages of the production process, ultimately increasing costs. This structure means that while a high-earning professional might see the benefits of zero income tax, the economic impact of consumption taxes can be felt more acutely by lower-income households whose spending patterns are more heavily taxed.
The state’s revenue model also relies on property taxes to fund local government, which is managed through a “split roll” system. This allows school districts to levy separate rates on different classes of property. Because the state favors certain property classes over others, the tax burden is not applied neutrally, which can distort economic decision-making regarding real estate and capital investments. To balance this, however, South Dakota generally exempts business inventory and tangible personal property from taxation, a move designed to keep the business climate competitive.
To understand how these various components interact, the following table outlines South Dakota’s specific component scores:
| Tax Component | National Rank | Score (0-10) |
|---|---|---|
| Corporate Tax | 1 | 10.00 |
| Individual Income Tax | 1 | 10.00 |
| Property Tax | 15 | 5.44 |
| Unemployment Insurance | 19 | 5.32 |
| Sales Tax | 31 | 4.47 |
Economic advantages and structural complexities
For the diverse economy of South Dakota—which spans agriculture, manufacturing, healthcare, and a growing remote-work sector—the tax code acts as both a magnet and a hurdle. In metropolitan hubs like Sioux Falls and Rapid City, the absence of income tax is a notable advantage for the growing number of remote professionals and retirees. According to taxformcalculator.com, high-income residents and retirees gain a clear advantage from the fact that retirement income is exempt from state taxation.
However, the economic burden is not distributed evenly. The reliance on sales and excise taxes—including those on gasoline, diesel, tobacco, and spirits—means that the state’s fiscal health is closely tied to consumer spending and tourism. In rural communities that depend heavily on seasonal tourism and cattle operations, these consumption-based taxes can influence local economic stability. The “so what” for the average taxpayer is a simple reality: your tax burden is determined less by how much you make and more by how you live and what you buy.
The state’s position among its neighbors also highlights its unique standing. While South Dakota ranks 2nd overall, its border states present a mixed bag of fiscal policies, with one neighbor ranking higher and five ranking lower. This geographic positioning reinforces South Dakota’s role as a regional outlier in the Midwest, offering a distinct alternative to the more traditional income-tax-heavy models found in many surrounding states.
As the state continues to manage its growth, the tension between its highly competitive income tax environment and its more burdensome sales tax system remains the central theme of its fiscal identity. The 2027 rankings confirm that while South Dakota has mastered the art of attracting capital and high earners, the cost of maintaining that model is a complex web of consumption and property-based levies that shape the daily finances of every resident.

Anchorage Police Shoot Burglar Who Fired Gun During Arrest
Anchorage Police Chief Reveals Suspect Stole Hundreds of Keys Before Fatal Shooting On October 29, 2026, a 33-year-old...
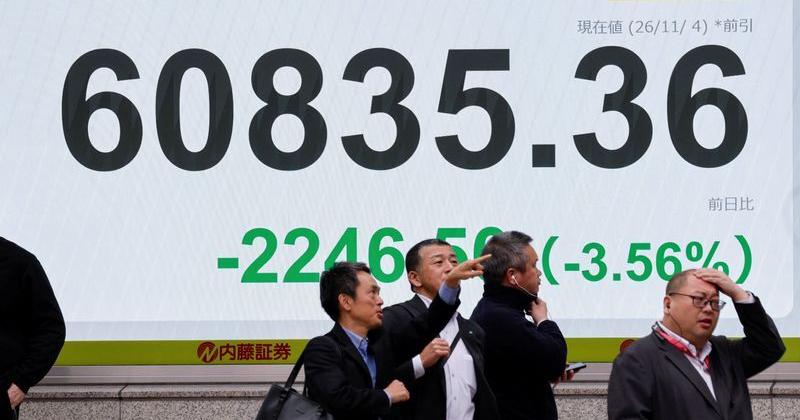
S&P 500 Loses $3 Trillion on Fears of AI Regulatory Crackdown
SINGAPORE – Asia's tech-heavy markets face a brutal Friday after a rout in US AI stocks, triggered by...

Alabama Appeals Court to Decide if Panhandling Laws Violate First Amendment
Alabama Fights to Revive Panhandling Bans After Unconstitutional Ruling Alabama is making a legal push to reinstate its...

It’ll affect schools and teachers and part of those families that are working in other industries
"It'll affect schools and teachers and part of those families that are working in other industries that aren't...