The shifting gender landscape across the United States
While the United States maintains a relatively balanced population, a subtle but distinct gender gap persists across the country. According to estimates from the United States Census Bureau, approximately 174 million females and 168 million males lived in the U.S. in 2025. This creates a national profile where women make up roughly 51% of the population, while men account for about 49%.
This national average, however, masks significant regional deviations. Mental Floss reported that while the split is close, the balance varies sharply from state to state, with certain regions skewing heavily toward one gender based on industry, education, and life expectancy. These demographic shifts aren’t just numbers on a spreadsheet; they influence everything from local labor markets to social structures.
The distribution of the population suggests that the “ideal” sex ratio is not a static figure. As noted by World Population Review, sex ratios are fundamental demographic parameters that reflect the interplay of birth, death, immigration, and emigration rates. These fluctuations can impact a population’s potential for growth and its economic composition.
Resource-heavy industries drive male populations in the North
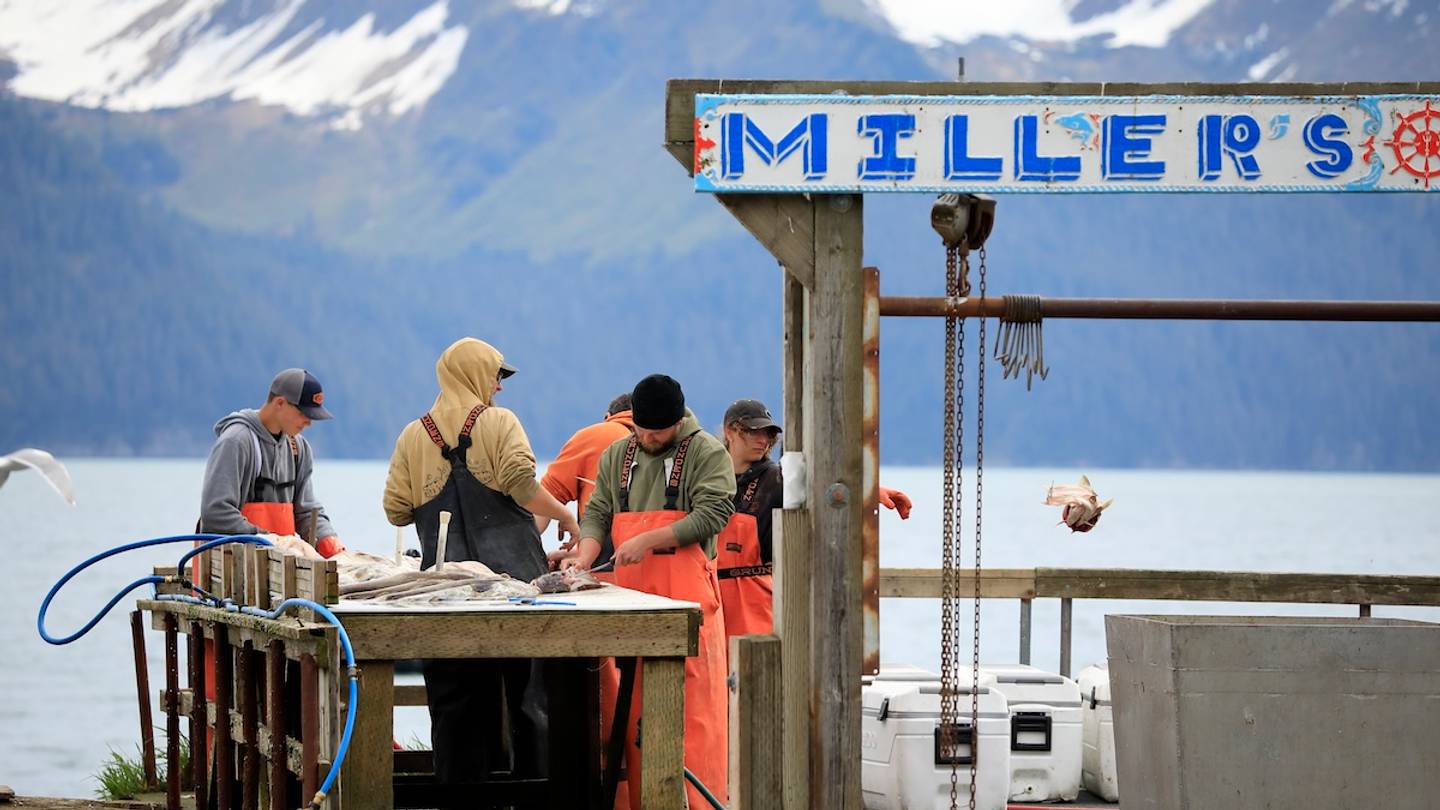
If you move toward the colder, northern reaches of the country, the data shows a clear tilt toward men. Alaska stands as the most prominent example, leading the nation with a ratio of 110.6 men for every 100 women. This imbalance is particularly pronounced in the western portions of the state, where male-dominated sectors like oil and fishing draw a significant workforce. While urban centers like Anchorage and Juneau show a more even distribution, the state’s overall demographic is heavily influenced by these industrial hubs.
Women Power in State Elections 2026 (Male:Female Ratio) Only West Bengal has more male voters than females amongst 5 states / UT Assam – 50% M; 50% F Kerala – 48.5% M; 51.5% F Puducherry – 47% M; 53% F Tamil Nadu – 48.9% M; 51.1% F West Bengal – 50.9% M, 49.1% F
This trend of male-heavy populations is concentrated in the Mountain West and the northern plains. The top five states with the highest male-to-female ratios include:
- Alaska
- North Dakota
- Wyoming
- South Dakota
- Montana
North Dakota, for instance, follows Alaska with a ratio of 105.1 males per 100 females, a shift driven largely by oil booms that attract male laborers to the region. These pockets of high male concentration often correspond with states that rely heavily on extractive industries and manual labor sectors.
Education and longevity shape female-majority regions
The demographic picture flips when looking toward the South and the East Coast, where women outnumber men. The District of Columbia holds the most significant gap, with a ratio of just 90.6 males for every 100 females. Data from the Census Bureau suggests this is driven by a trend of college-educated women moving to the District in higher numbers than their male counterparts.
This pattern extends into several East Coast and Southern states. The states with the highest female-to-male ratios are:

| Rank | State/District | Male to Female Ratio |
|---|---|---|
| 1 | District of Columbia | 90.6 |
| 2 | Delaware | 93.9 |
| 3 | Mississippi | 94.2 |
| 4 | Alabama | 94.4 |
| 5 | Maryland | 94.8 |
While migration and education play roles in the District and Delaware, biological factors like life expectancy contribute to the imbalance in the South. According to the Yale School of Public Health, women live longer than men on average, with a national life expectancy of 84.1 years compared to 80.3 years for men. In Mississippi, this gap is particularly visible, where women live to an average of 76.6 years while men average 71.8 years.
There is a complex economic side to these numbers as well. World Population Review points out that despite the gendered distribution of the population, the female labor force participation rate was only slightly more than half in 2018. This suggests that even in states where women are the demographic majority, their integration into the workforce does not always mirror their population share.
The pockets of demographic parity
Despite the extremes found in Alaska or D.C., much of the country exists in a state of near-equilibrium. The Midwest contains some of the most balanced populations in the nation. Minnesota and Wisconsin sit very close to a perfect 1:1 split, with Minnesota recording 100.4 males per 100 females and Wisconsin following closely at 100.3.
On the other side of the scale, West Virginia and California represent the closest points of parity for female-leaning populations. Both states sit at 99.8 males for every 100 women, representing a nearly even distribution of the sexes.
The tension between these demographics often creates a “so what” for local economies. In male-dominated states, the economy can become highly sensitive to the volatility of industrial sectors like energy. In female-dominated regions, the concentration of highly educated women can reshape urban service economies and educational landscapes. As these trends continue, the geographic divide between the “industrial north” and the “educated south” may only become more pronounced.
Keep reading
University of Idaho Receives $579,000 for Specialty Crop Research
University of Idaho researchers secure $579,000 for specialty crop innovation Researchers at the University of Idaho College of...

Georgia man hit with $17,500 cruise ship medical bill
“Since this has happened, I wake up every morning with the weight of the $17,500 on my shoulders,”...

South Carolina Stingrays Defeat Orlando Solar Bears 4-1
“We have to play hard, we have to be detailed,” Stingrays defenseman Jérémie Biakabutuka said, reflecting on the...

Georgian Court Lions secure CACC title with 2-1 win over Bridgeport
Georgian Court Lions Secure CACC Title with Comeback Win Over Bridgeport The Georgian Court Lions men's soccer team...