
The S&P 500 closed at 6,910.39 on Friday extending a seven-session losing streak that pushed the index 11.6% below its October 6 record and into correction territory for the first time since March 2025.
The streak matches the seven-day slide that ended February 28, 2020, at the start of the pandemic selloff. If the index rises on Monday, November 23, the run ends at seven; a decline would make it eight sessions, the longest since November 2016. The State Street SPDR S&P 500 ETF Trust (SPY) closed at $689.81 on Friday after falling 3.64%.
The index is now 11.6% below its October 6 record close of 7,818.93. That puts it in a correction, which means a drop of at least 10% from a record. Even so, the index is still up 0.95% for 2026, so nearly a full year of gains disappeared in about six weeks.
AI Concentration Magnifies the Drop
NVIDIA tumbled 13.8% on Friday, dragging the market-cap-weighted SPY down 9% for the week while the equal-weight Invesco S&P 500 Equal Weight ETF (RSP) lost 7%. As of March 17, 2026, NVIDIA accounted for 7.58% of SPY’s net assets, so a handful of AI-linked giants can move the whole fund.
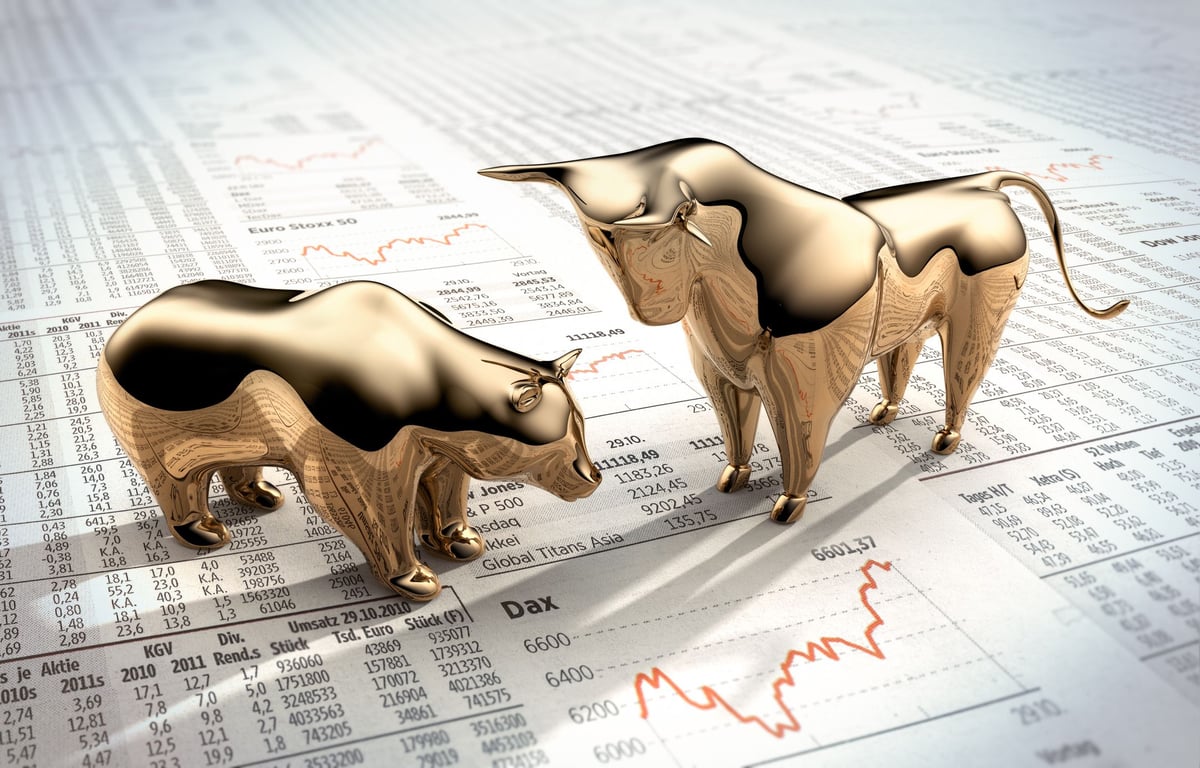
Blikre estimated the index shed about $2.4 trillion in market value on Friday alone and nearly $6 trillion over the week. November’s 8.83% decline is the worst for the month since November 1973, when the index fell 11.39%. The Nasdaq-100 dropped 10.4%, the Dow lost 8.0%, and the Russell 2000 slid 7.5%. The tech-heavy Nasdaq Composite had lost its year-to-date gain, and was now down 2.7% in 2026.
The 200-Day Average Break: What History Shows
The index closed 6% below its 200-day moving average at 7,349, ending a 155-session run above the line that began April 8. Real Investment Advice notes that since 1950, 18 of 34 first closes below the average after a 150-day run above it recovered within four weeks. But all eight breaks that ran 2.9% or more below the average in the first four sessions stayed below it at week four. This break started at four points under on November 17 and deepened to 6% under by Friday. Panmure Liberum strategist Joachim Klement cited the break as his trigger to move his personal retirement portfolio from equities into long-term government bonds.
Meb Faber’s trend-following research showed such discipline kept investors out of the worst of the dot-com bust and the financial crisis. However, Faber’s model only checks the 10-month average once a month. Once a month equals 4 weeks, which filters out breaks below the 200-day average that didn’t stick.
When breaks stick, the average maximum drawdown over the next three months was −8.6% versus −1.9% for those that reversed; the worst cases — 1962, October 1987, February 2020 — fell roughly 24% to 25% from the signal close within a year.
Technical Signs and Sentiment Gauges
Angelo Kourkafas, senior global investment strategist at Edward Jones, said that when the VIX has closed above 30 for the first time in a cycle, the S&P 500 posted an average total return of 8.1% six months later.
Sentiment is very fragile at the moment.
Angelo Kourkafas, senior global investment strategist at Edward Jones
There are some tell-tale signs we have a moment where the fear is detached from the strong fundamentals of earnings growth.
Michael Reynolds, vice president of investment strategy at Glenmede
Bruce Zaro, managing director at Granite Wealth Management, said one breadth indicator — the small number of NYSE stocks at 52-week highs versus lows — suggested a bottom, though a second measure, the percentage above their 50-day moving averages, had not yet reached a "washout." Michael Arone, chief investment strategist at State Street Investment Management, was watching declines from 52-week highs and the extent of tandem selling, metrics moving closer to oversold levels but not yet at extremes.
In the near term, analysts were turning to technical indicators, market internals and other metrics for signals of a possible bottom.
We are getting close to a great dip-buying point.
Bruce Zaro, managing director at Granite Wealth Management
Historical Precedent: Four-Week Losing Streaks From Records
The Motley Fool analyzed 12 occasions since 1970 when the S&P 500 fell four straight weeks after hitting a new all-time high. Six months later, the index was higher in 10 of 12 instances with a median gain of 13.4%, more than double the 5.2% median six-month gain for an average week. Over 12 months, it was higher in 11 of 12 cases with a median gain of 16.5%.
The recovery usually isn’t immediate: one month out, positive returns are roughly a coin flip; the odds swing in favor by three months. Specific historical instances include May 12, 1972 (3.4% decline, 5.2% gain at 3 months), February 18, 2014 (6.2% decline, 7.0% gain at 3 months), May 31, 2019 (6.6% decline, 6.3% gain at 3 months), August 23, 2019 (5.9% decline, 9.2% gain at 3 months), September 25, 2020 (7.9% decline, 12.3% gain at 3 months), August 9, 2024 (5.7% decline, 12.2% gain at 3 months), and March 14, 2025 (6.5% decline, 12.8% gain at 3 months).
What to Watch This Week
Thanksgiving compresses trading into three sessions: markets are closed Thursday, November 26, and close early at 1:00 p.m. ET on Friday, November 27, which can amplify price moves in light volume. The next key level is 7,349 — the 200-day average. Any snapback toward it would be normal from an oversold extreme; what matters is whether the index can close and hold above it. Earnings season is largely done, but Micron Technology reports December 17, which could have broad implications for the AI investment outlook. Mark Hackett, chief market strategist for Nationwide, cautioned that “emotional investors can overwhelm opportunistic ones in the short term,” while Tim Ghriskey, senior portfolio strategist at Ingalls & Snyder, said “there are many valuations that are still excessive…. This seems like a real correction which has further to go.” The Federal Reserve’s next meeting is on December 8-9.
Fed Governor Christopher Waller called for a 50-basis-point hike at the December 8-9 meeting after a third straight 0.3% monthly gain in core CPI. Wednesday brings October personal income and spending. Meanwhile, the 10-year Treasury yield fell 24 basis points, and the long-bond ETF (TLT) gained 2.6% while nearly everything else fell. When bonds rally as stocks drop, investors are running from risk rather than scrambling for cash. If Treasuries start selling off alongside stocks, the liquidation has moved into a more dangerous phase.
Desk chatter also had investors selling gold, copper, crypto and Nvidia to fund allocations in Anthropic’s IPO, which priced at $83 on Wednesday. Gold fell 9.5%, copper 10.2% and Bitcoin broke below $60,000. On Thursday, just 38 S&P 500 stocks rose while 464 fell, and all 11 sectors finished lower, even staples.
Goldman’s Rich Privorotsky called it “a pretty violent liquidation” in a note covered by ZeroHedge. Dealers were heavily short gamma into Friday’s monthly options expiration, which fed the afternoon selling.

Tallulah Willis Deletes, Apologizes for ‘Too Intimate’ Photo of Bruce Willis
Tallulah Willis, 32, deleted an Instagram photo of her father Bruce Willis on Sunday after deciding the image...

The Irish Times Names 10 Best Cinematic Food Moments From Silent Era to Modern Day
The Irish Times has named ten cinematic food scenes that have lingered in cultural memory from the silent...

Anthropic’s Levent Alpöge Claims Claude AI Helped Prove Riemann Hypothesis
Anthropic mathematician Levent Alpöge announced on Nov.

Hunger Games: Sunrise on the Reaping’ Opens to $120M Domestically
“The Hunger Games: Sunrise on the Reaping” opened to $120 million domestically, claiming the top spot at the...