A Satellite’s Eye View on West Baton Rouge
Right now, somewhere over West Baton Rouge Parish, a satellite is watching. It sees the heat. An AI system confirms it’s a fire. On a map at wfca.com, a tiny icon pops up, glowing red, linked to the frantic 911 call that just came in. This is the new reality of wildfire tracking in Louisiana, a state not typically thought of as a fire frontier, where technology is stitching together a lifeline between a spark and a response.
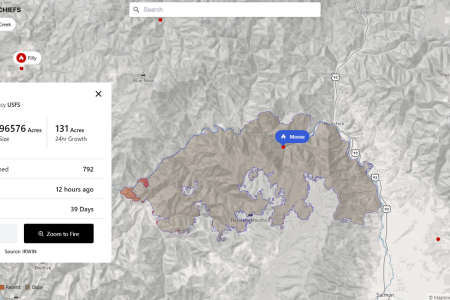
The Western Fire Chiefs Association (WFCA) Fire Map is the engine driving this change. It’s not just a picture; it’s a living dashboard of America’s fire fight. The map pulls in data from a constellation of sources: NASA’s polar-orbiting satellites and NOAA’s geostationary ones that stare constantly at one spot on Earth. An AI system called Satellites on Fire (SoF) acts as the final arbiter, sifting through the raw data to confirm what is, and is not, a wildfire. When a fire is detected, the map layers on critical context: Red Flag Warnings from the National Weather Service, live dispatch calls, and even the real-time location of firefighting aircraft on their way to the scene.
The Human Toll in Real Time
For the residents of West Baton Rouge, this isn’t just data; it’s potential. It’s the difference between a contained backyard brush fire and a threat to a home. The map’s ability to show fire growth, track containment percentages, and link to live dispatch feeds provides a level of transparency that was unimaginable a decade ago. It gives families near a fire line a crucial edge—knowledge. They can see if resources are being allocated, if the wind is shifting, and what the immediate forecast holds for smoke and flames.
Think about the person who calls 911. They don’t just report a fire; they report a moment of crisis. The PulsePoint integration on the WFCA map means that when that call comes in, it’s plotted on the map in near real-time. For first responders, this visual representation is invaluable. It helps them understand the scope of the incident before they even turn on their sirens, allowing for a more strategic and safer deployment of personnel and equipment.
But this technology also exposes a deeper, more complex story. The WFCA map’s fire-weather outlooks, provided by the National Weather Service and NOAA’s Storm Prediction Center, are shown on the map.
The Western Fire Chiefs Association (WFCA) Fire Map displays almost immediate wildfire activity across the western United States and Alaska. Satellite detection comes from NASA FIRMS (VIIRS, MODIS, and Landsat) and NOAA’s GOES geostationary satellites, with Satellites on Fire (SoF), an AI system, confirming these satellite detections. The National Weather Service (NWS) and NOAA’s Storm Prediction Center (SPC) supply fire-weather warnings and forecasts — Red Flag Warnings and fire-weather outlooks. Explore the live map at wfca.com/fire-map.
The data is a tool, not an infallible oracle. The fire dispatch and location information is, by its very nature, approximate. The map is a guide, a powerful one, but it cannot replace the boots on the ground, the eyes in the sky from a circling helicopter, or the experience of a firefighter reading the wind and the fuel. The map shows the “what” and the “where,” but the “how” and the “why” still require human expertise and judgment.
The Economic and Ecological Stakes
The WFCA map helps mitigate this risk by providing early warnings. The live perimeter tracking and 3-hour spread forecasts, particularly for California fires via the FIRIS system, offer a glimpse into a fire’s potential path.
As we look at the glowing icons on the WFCA map, it’s easy to get lost in the technology. But each icon represents a real event—a threat, a response, a community on edge. The map democratizes information, giving everyone from a concerned citizen to a state fire marshal a shared, real-time view of a crisis.
Worth a look

Las Vegas Court Warns Residents of Fake Jury Duty Summons Scam
The Eighth Judicial District Court is warning Las Vegas residents about a jury duty scam involving fraudulent notices....
Valley Center City Departments Described
Valley Center, KS maintains a comprehensive network of municipal departments to provide essential services to its community. The...

Lions Prepare for Miami Game Inspired by Jack Campbell
The Lions honor Jack Campbell with a blitz-heavy defensive strategy "We're going to think of Jack and play...

Judge halts Mississippi state effort to revoke Canton charter school
Mississippi Judge Puts Canton Charter School Shutdown on Hold A Hinds County chancery judge has temporarily halted the...