
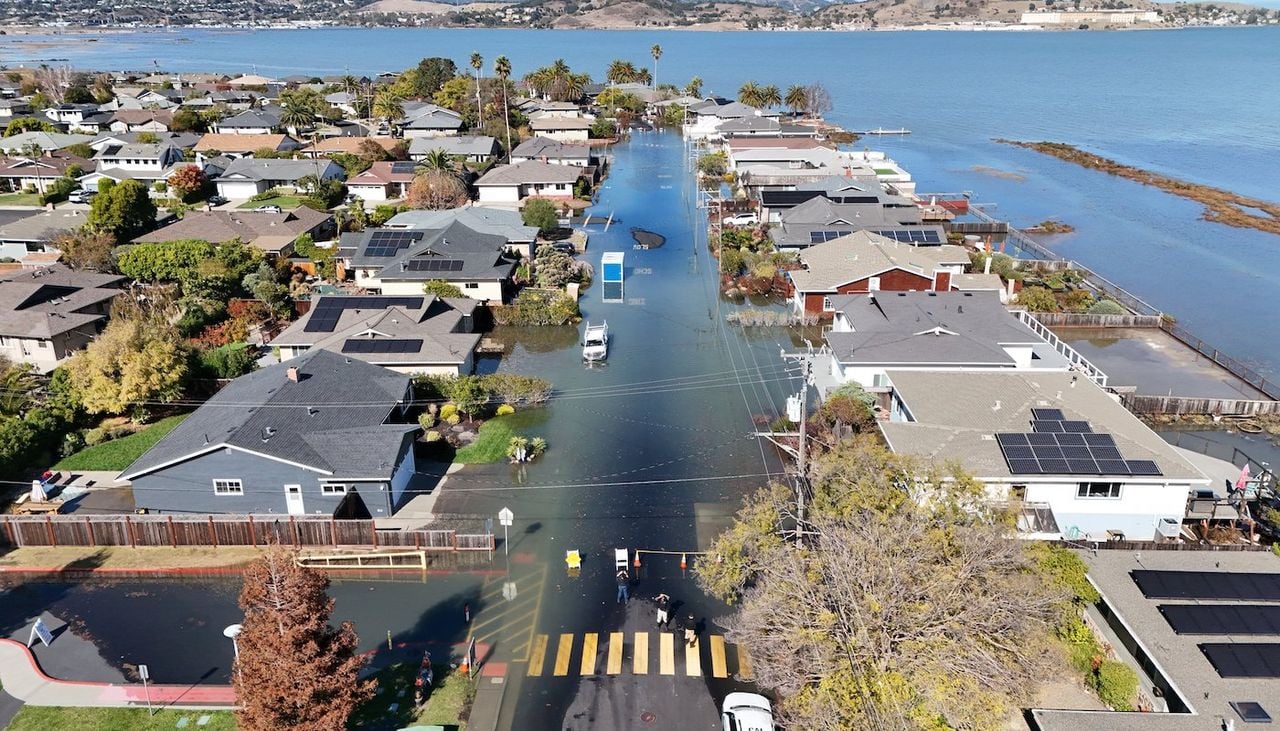
Coastal communities in California experienced the impact of this year’s intense El Niño last week, as elevated water levels submerged regions of the state with lower elevations. NOAA tide gauges across the state documented these water levels, with some sites achieving their most elevated measurements on record, based on data stretching back over a century.
Record Water Levels
From October 24 to 30, 2026, locations along the California coast observed heightened water levels, recorded above Mean Higher High Water (MHHW). Four locations achieved their greatest water levels ever recorded: La Jolla, Monterey, Santa Monica, and Port San Luis. Other locations saw water levels surpass their top-ten highest observed. NOAA’s tide gauge at San Diego, California, captured its highest water level on record, 2.80 feet above Mean Higher High Water (MHHW) on October 27, 2026.
An El Niño-fueled “coastally trapped” ocean wave is forecast to raise sea levels along the U. S. West Coast within weeks. When these elevated seas, storms and high tides coincide this fall and winter, coastal flood threats will greatly increase. A big deal for California! 🧵 pic.twitter.com/xjWHvLIaw0
Above-Normal Tides and El Niño
These record water levels are the result of several factors. The first is higher-than-normal astronomical tides caused by a perigean spring tide, when the moon was full and closest to the Earth. El Niño-driven Kelvin waves pushed water levels even higher. These waves bring pulses of warm water eastward, temporarily raising sea level by 6-12 inches or more. An ongoing marine heatwave is also a contributing factor, as warmer water expands, a concept known as thermal expansion. The combined effects have driven water levels to record heights, flooding roads and disrupting daily life.
Potential for More High Water
NOAA anticipates above-normal high tides will take place from November 22-27, 2026, and December 22-26, 2026, which will bring a greater chance of flooding. These dates will also feature a perigean spring tide. Additional Kelvin waves are expected due to continuing El Niño conditions, which will keep water levels high. NOAA’s National Weather Service Winter Outlook forecasts wetter-than-average conditions for the southwestern U.S., which could worsen coastal flooding. Communities can use NOAA’s Monthly High Tide Flooding Outlook to see days with an increased risk of flooding and NOAA’s Coastal Inundation Dashboard to monitor water levels in real-time.
Keep reading

RI Working Families Party sees major election growth in power
Working-Class Champions Win Across Rhode Island “Rhode Island is at an inflection point, and tonight voters chose leaders...
For decades, Pennsylvania’s Democratic legislators have been stymied, their environmental and
A New Era for Pa. Energy Policy, With Data Centers and Fracking in the Crosshairs For decades, Pennsylvania’s...

Two Wanted in Ohio Brothel Network Probe
Two suspects are on the run from Ohio authorities after a sweeping human trafficking investigation uncovered what officials...

Christine Drazan faces questions after Oregon gubernatorial defeat
Republicans Face a Familiar Oregon Question After Governor's Race Defeat On the night of November 3, 2026, at...