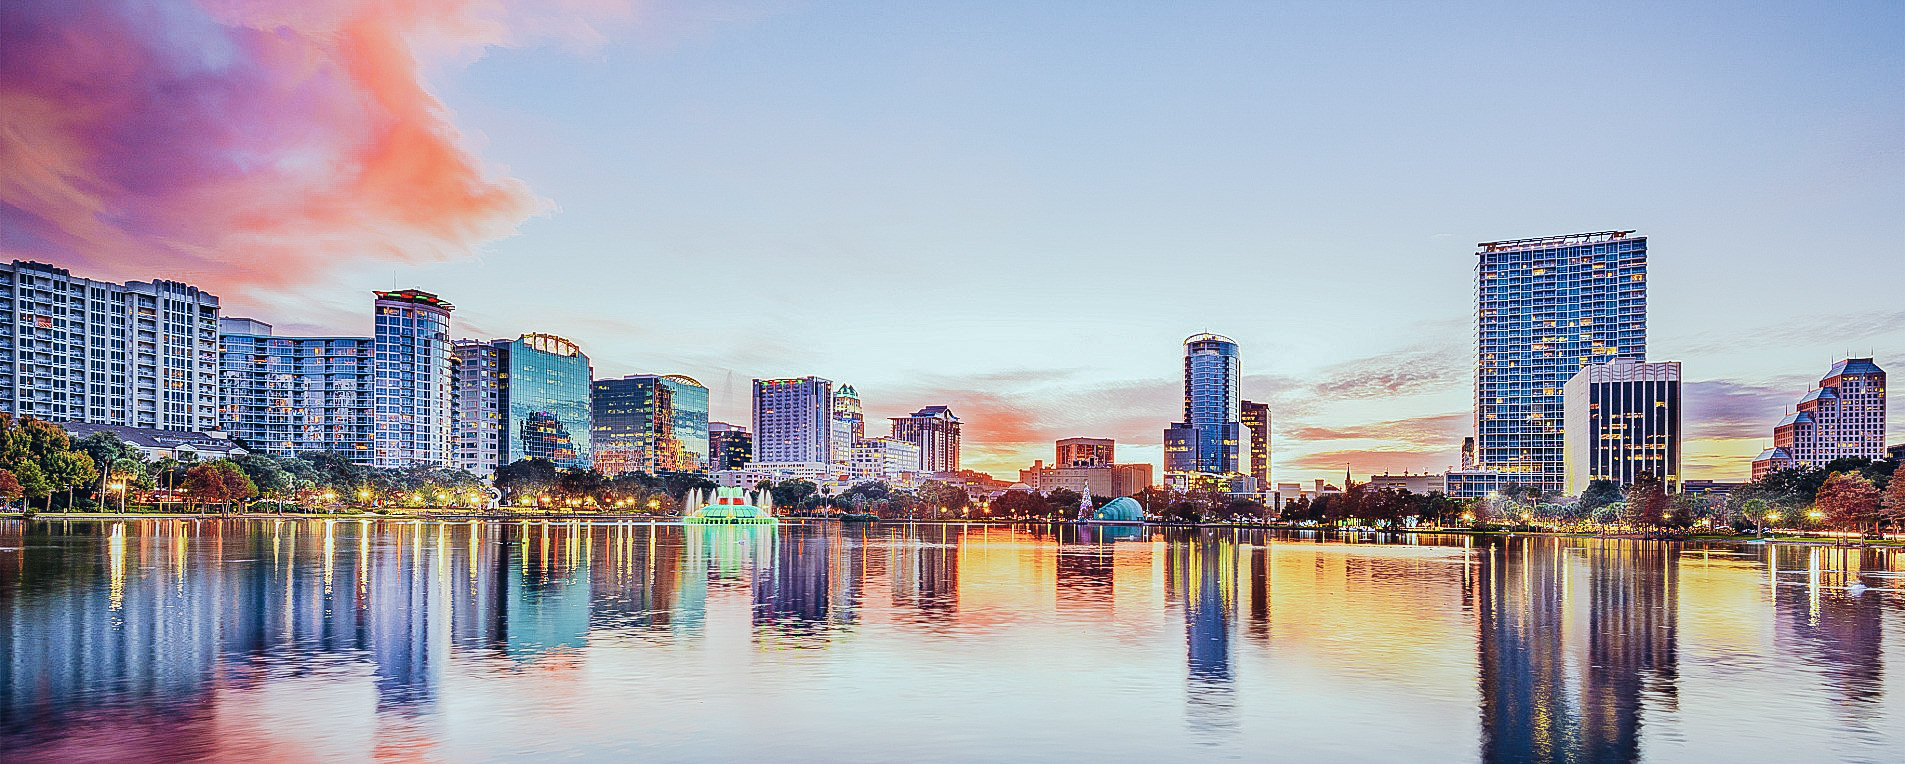
Orlando absorbed 107,000 square feet of retail space in the third quarter of 2026, trailing far behind the 679,000 square feet absorbed during the same period last year. That slowdown in tenant demand pushed the metro area’s vacancy rate up to 3.8%, marking a 14-basis-point increase compared to the third quarter of 2025.
Trailing-12-month absorption has cooled significantly, dropping to 550,000 square feet from 961,000 square feet a year earlier. Even with the moderation, developers continue to deliver new inventory into an increasingly tight market.
West Seminole Records Tightest Vacancy While Northwest Orange Leads Rent Growth
Real estate performance across Central Florida varies dramatically by submarket. West Seminole Outlying stands as the tightest submarket in the region, recording a razor-thin vacancy rate of just 0.6%. Meanwhile, Northwest Orange Outlying leads the metro in rent growth, pushing up by 3.8% year-over-year.
Across the broader market, asking rents reached an average of $31.17 per square foot, while other data tracked asking rents at $31.19 per square foot. That represents a 2.5% to 2.6% increase over the past year, placing Orlando’s rent performance well ahead of the 1.7% national average and close to the Q2 2026 peak of $31.18 per square foot.
Four of the five largest leases signed over the past year are in projects not scheduled to deliver until 2027, with lease sizes in newer properties averaging more than 30.0% above the overall market average. Malls, power centers, and strip centers served as net givers of space, shedding roughly 214,000 square feet, 135,000 square feet, and 116,000 square feet respectively. This pushed mall vacancy to 7.0% and power center vacancy to 6.8%, even as power centers recorded the strongest property-type rent growth at 3.5% year-over-year and malls commanded the highest asking rents at $43.69 per square foot.
Downtown Orlando Holds Largest Concentration of Active Construction
Supply additions remained modest, with Orlando delivering 110,000 square feet in the third quarter and 1.03 million square feet over the trailing twelve months, which represents a 10% decline compared to the prior twelve-month period. For historical context, annual deliveries peaked back in 2007 at 5.83 million square feet.
Space currently under construction accounts for 0.5% of total inventory. Downtown Orlando holds the largest concentration of active construction at 8.0% of its stock. Nearly 835,000 square feet remained under construction across 42 properties, with 65.0% preleased. Major projects underway include a 405,000-square-foot community center in Lake Nona West anchored by Target and Nordstrom Rack.
Trading volume on the exchange increased significantly. Orlando recorded $1.9 billion in sales over the trailing twelve months, representing a 29% increase compared to the prior TTM period, with the third quarter alone accounting for $473 million. Year-to-date sales volume reached approximately $1.4 billion across 444 transactions, approaching the $1.5 billion recorded during the full year of 2025 and pushing total transaction volume since 2023 to about $5.0 billion.
General retail and neighborhood centers drove the vast majority of year-to-date transaction volume. General retail led with approximately $772 million across 316 transactions, followed by neighborhood centers at $464 million across 76 deals. Average cap rates compressed for four consecutive quarters down to 6.68% (noted as 6.7% in some data), sitting 63 basis points below the Q1 2015 high of 7.31%. Pricing held steady at an average of $303 per square foot according to some metrics ($284 per square foot per other data).
Worth a look
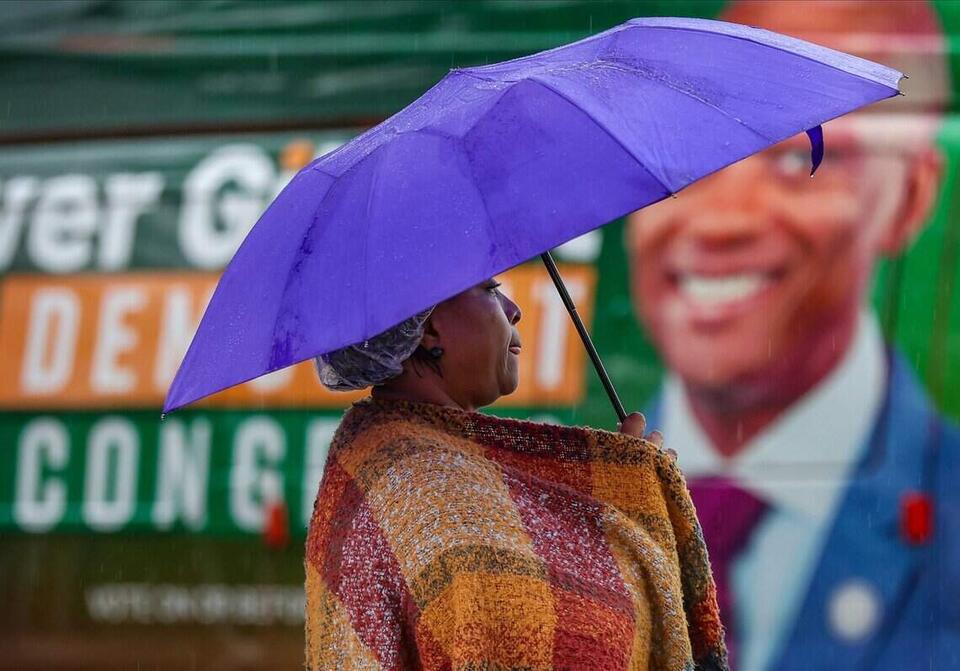
South Florida Voters Head to Polls Despite Flooding and Rain in 2026 Midterms
Flash Flooding and Relocated Precincts Fail to Halt South Florida Midterm Voters Flash flooding across central and South...
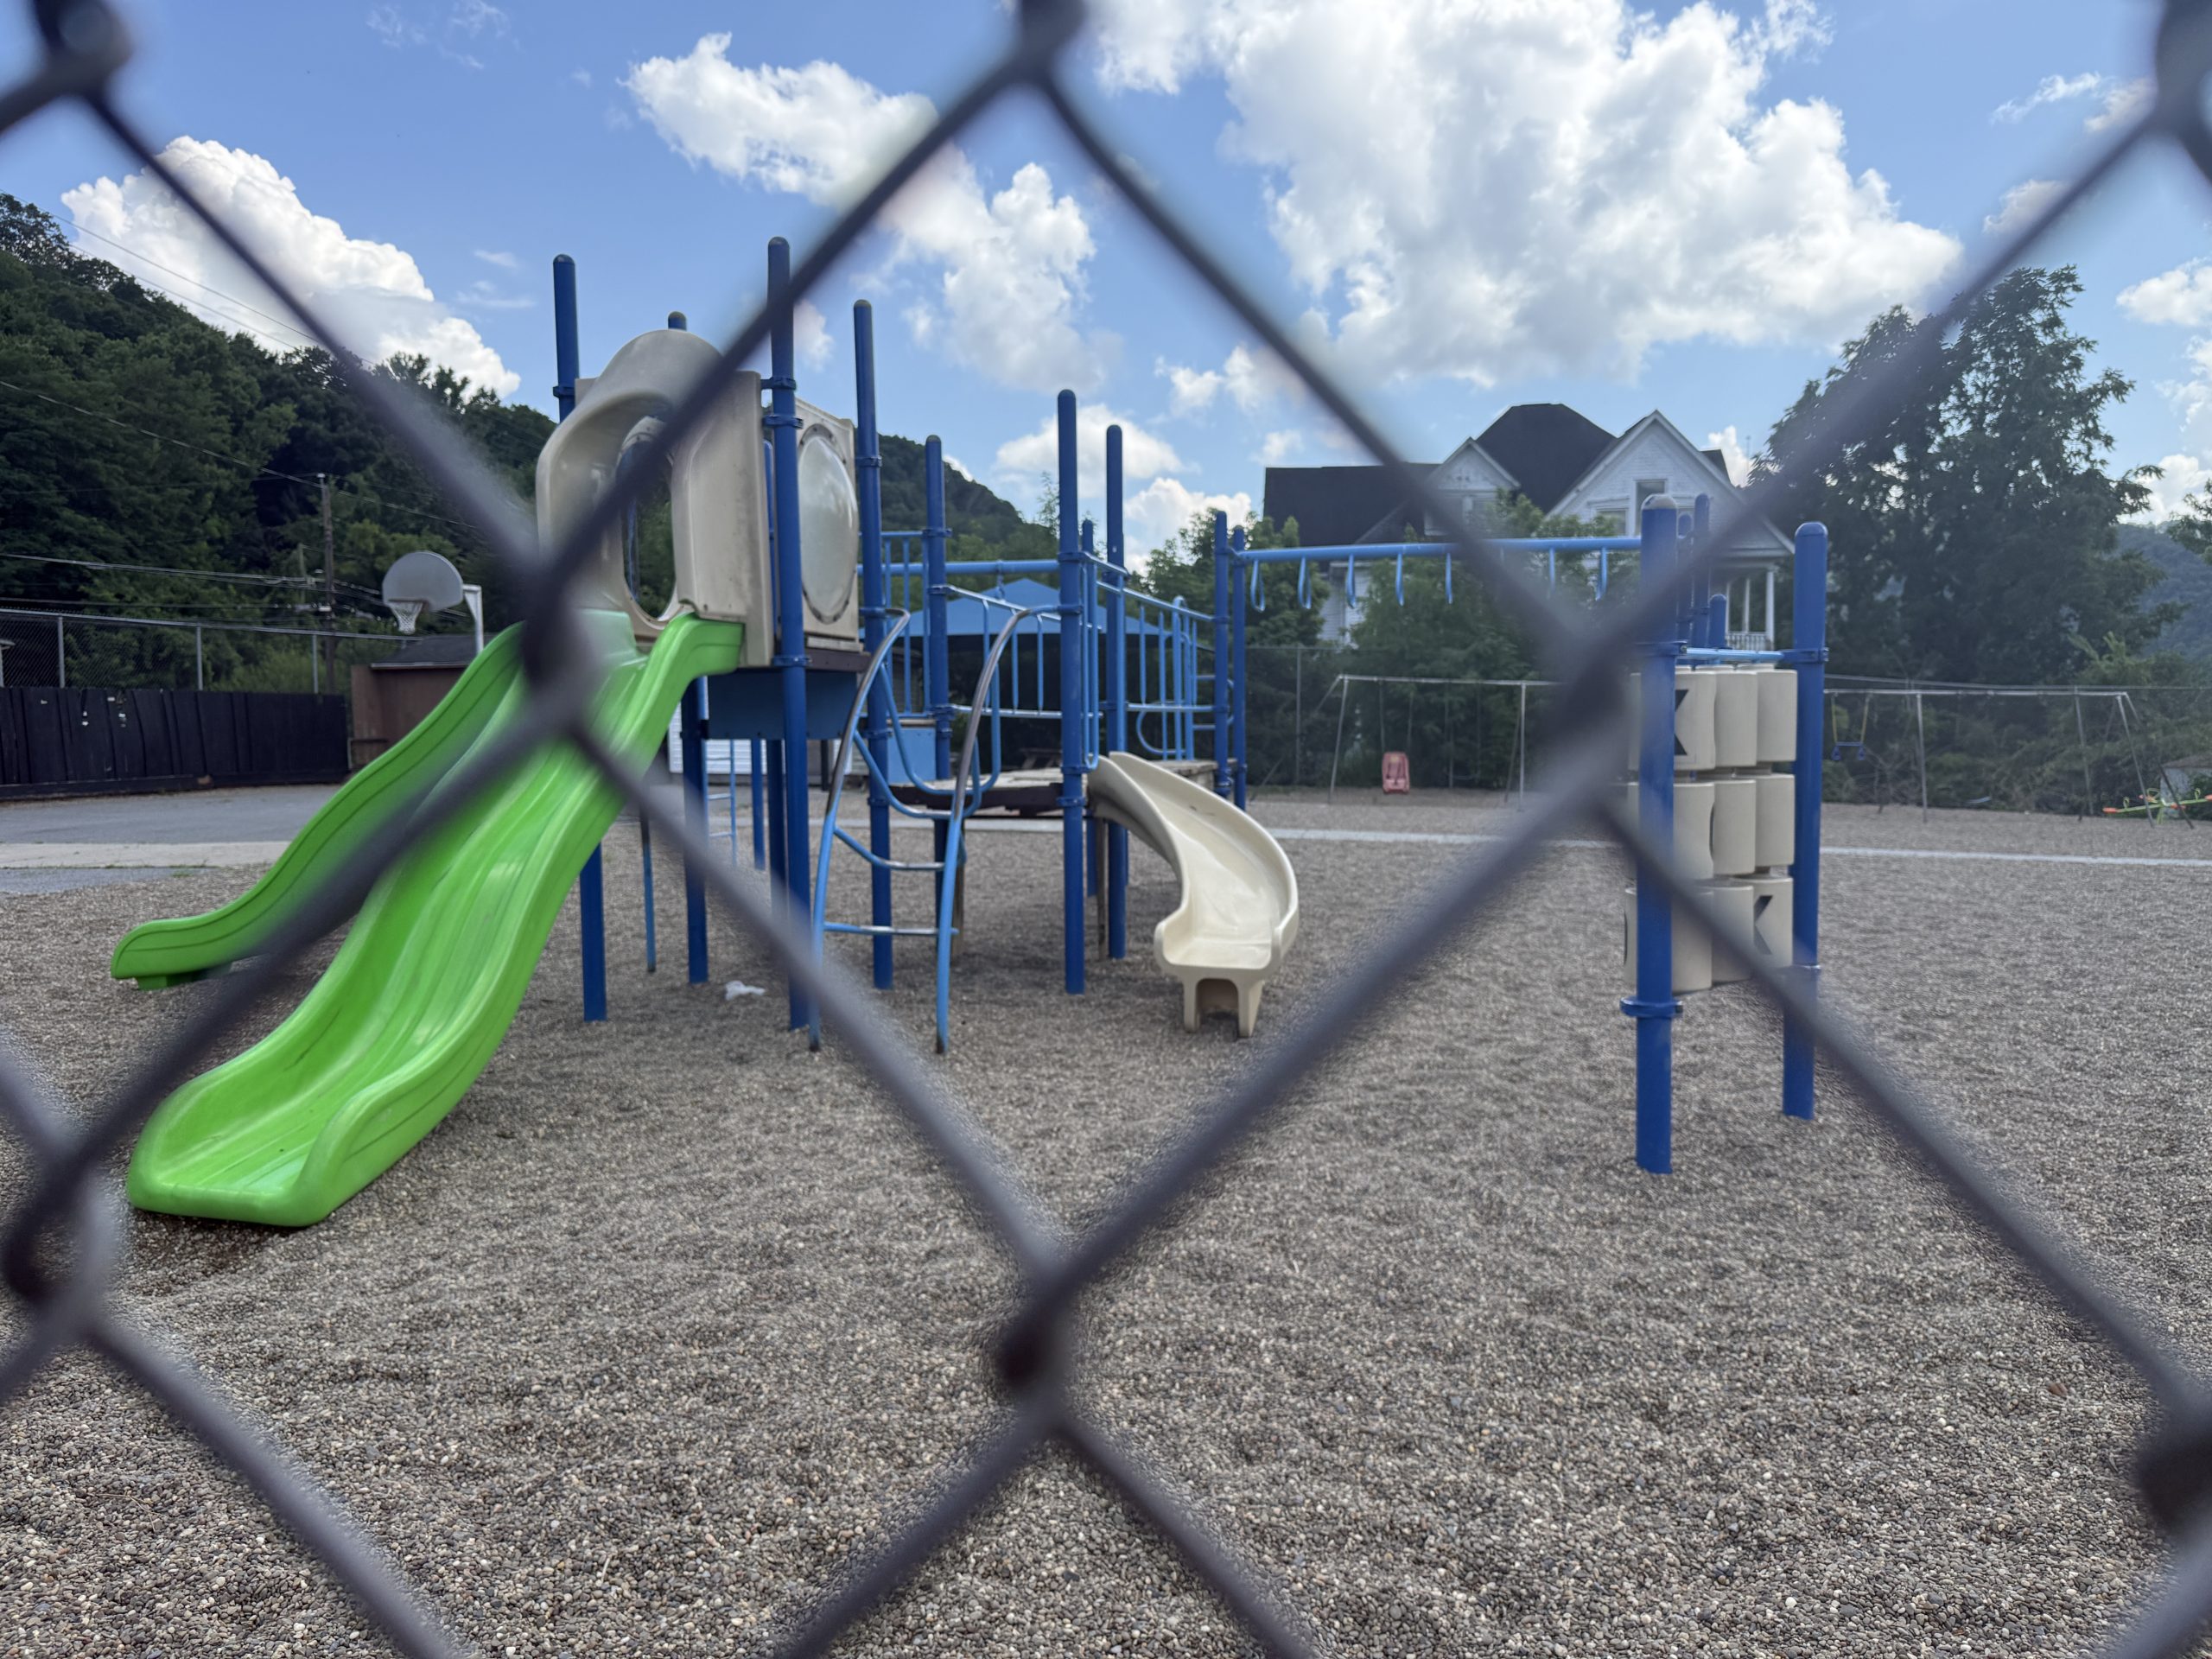
West Virginia Voters Approve School Levies in Four Counties
Voters in Jackson, Kanawha, Marshall, and Mason counties chose to raise their own property taxes on Tuesday to...

Claudia Jimenez narrowly leads Ahmad Anderson in Richmond mayoral race
If I win, I will be the first immigrant woman holding this position. Early election returns from Tuesday...
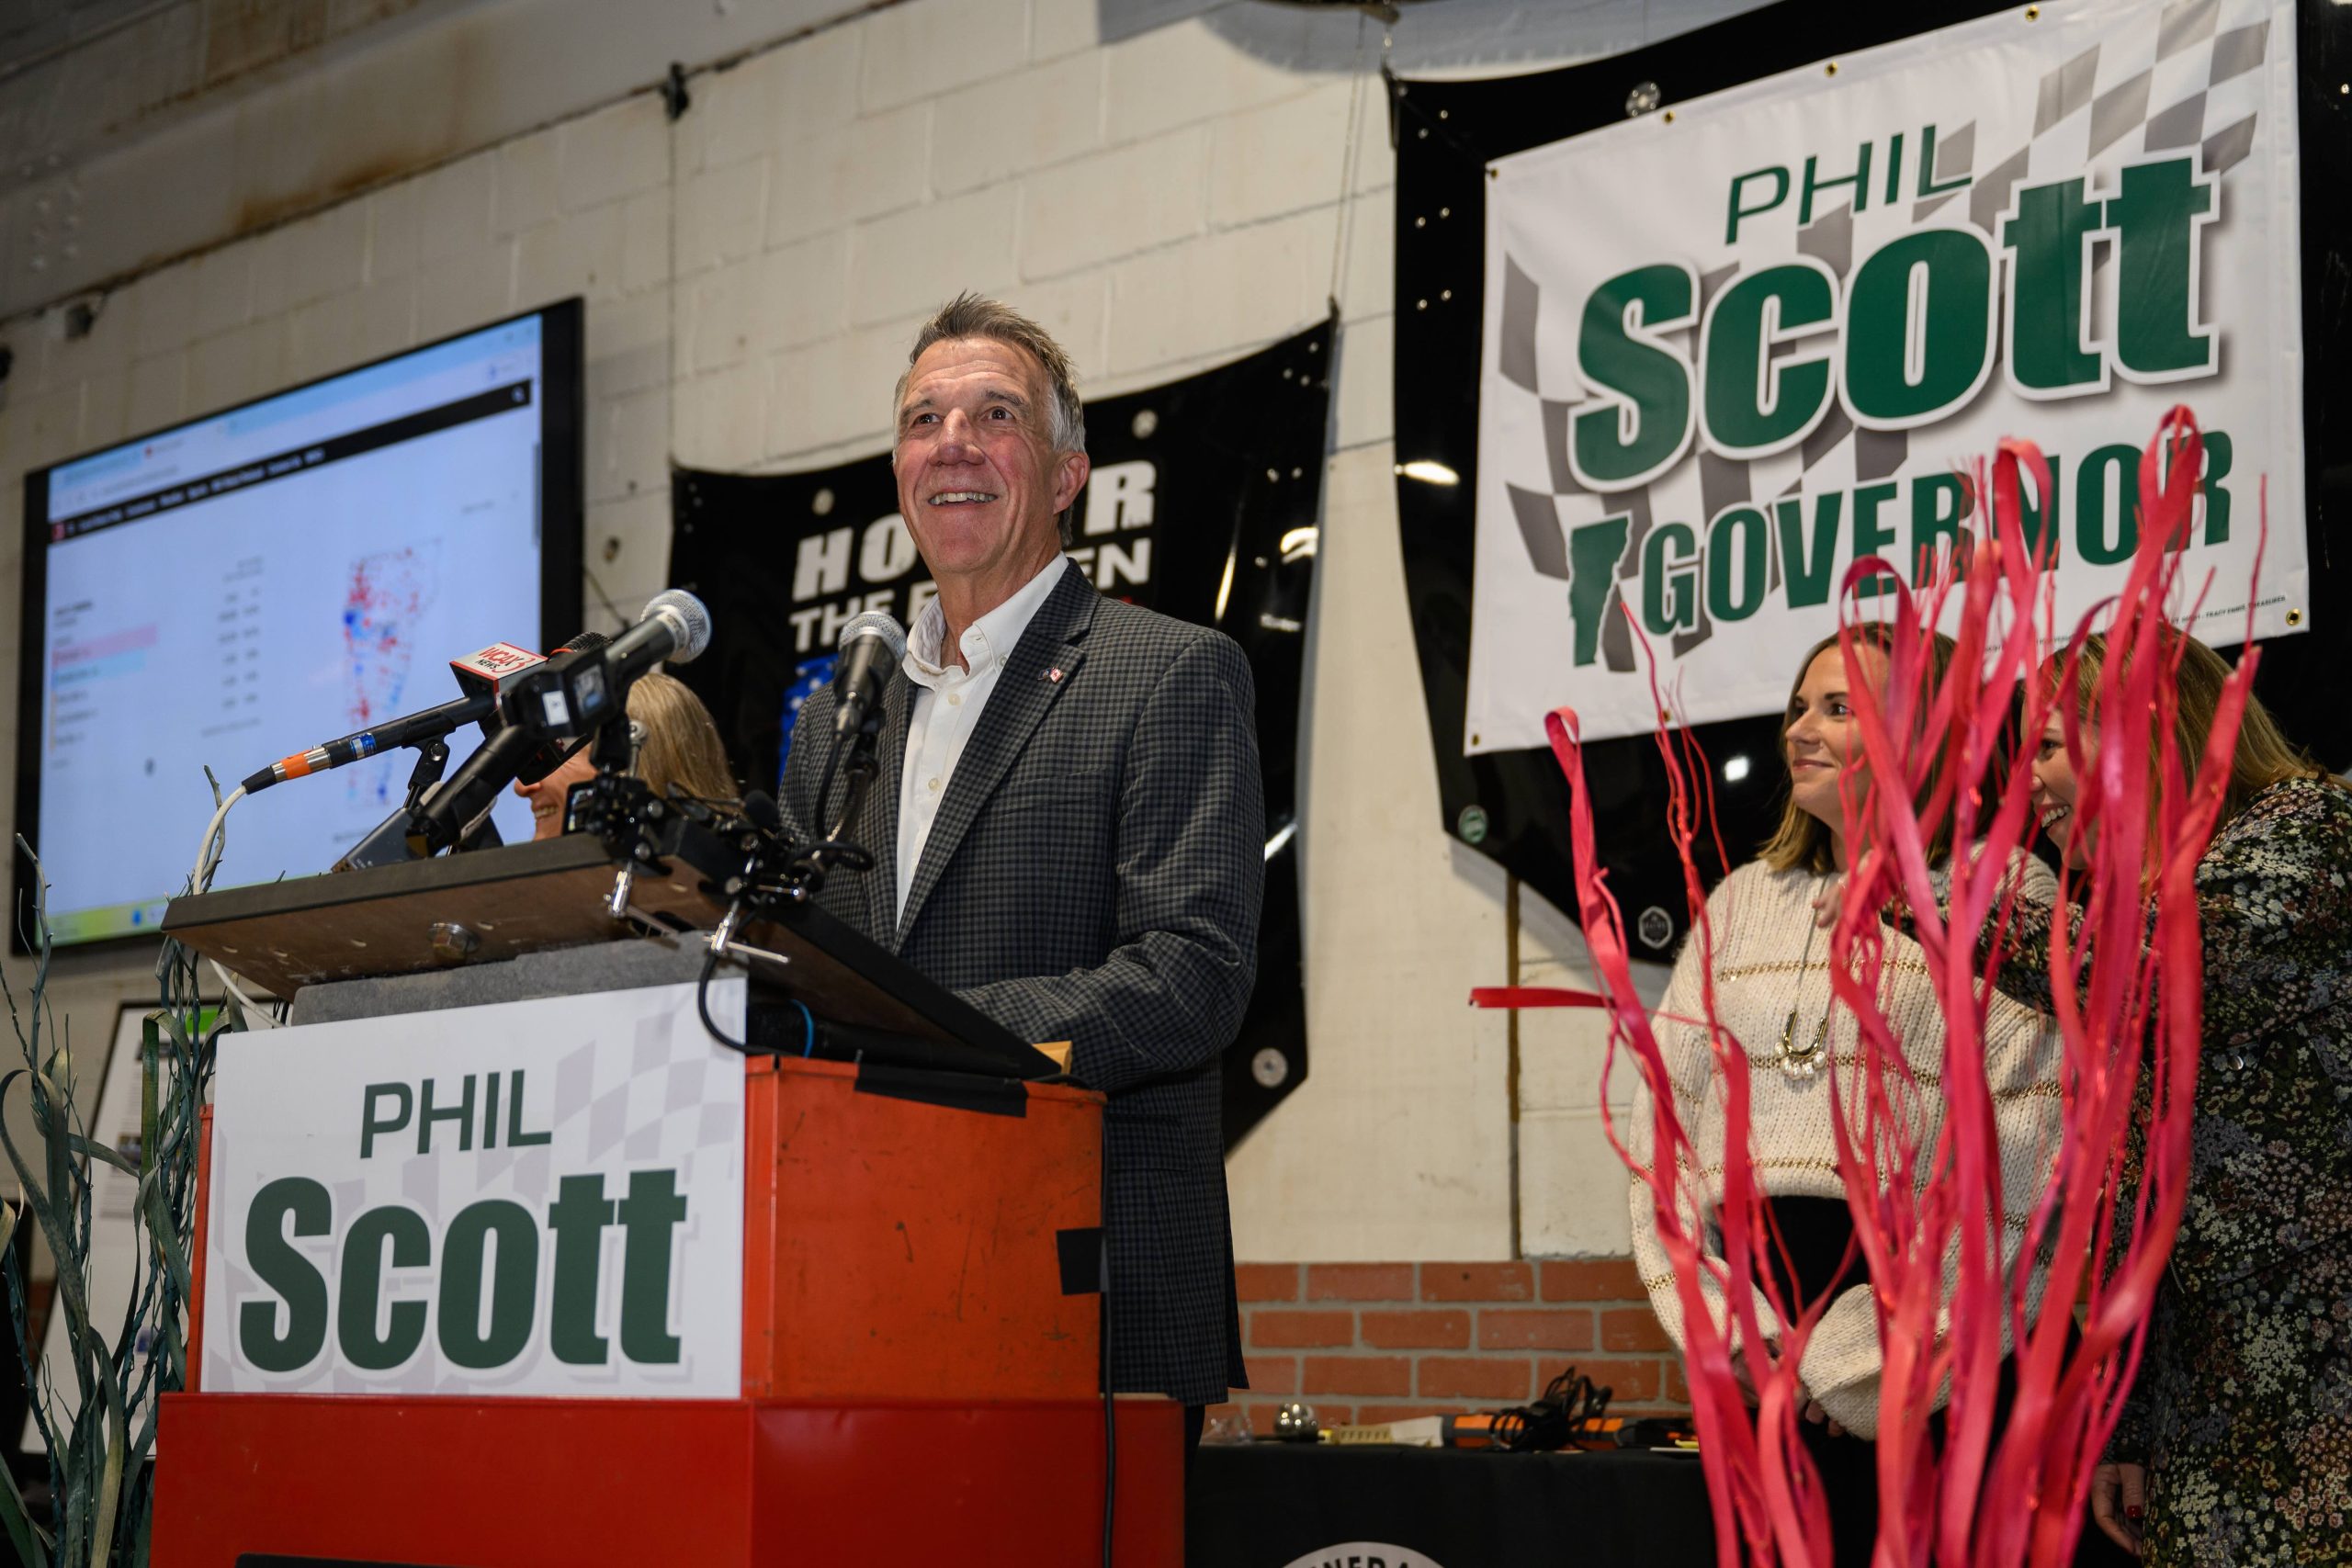
Phil Scott Wins Historic Sixth Term Amid Democratic Gains in Vermont
Phil Scott Wins Historic Sixth Term as Vermont Governor Vermont Gov. Phil Scott triumphed on Tuesday to capture...